There are a number of features with the Checkup Report that are noteworthy and will make zeroing in on problems easier.
More details are provided on each specific feature further down, but briefly, here are the enhancements we will be reviewing:
- When configuring, use the option to email the Checkup Report to an alternate email list when errors or warnings are detected by the Checkup Report. This is helpful, for example, to automatically send the Checkup Report to a ticketing system or escalate the issue to management.
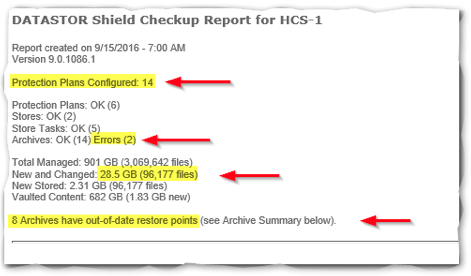
- The Summary section at the top of the report will highlight key stats like how many plans are configured to run and how many actually ran and if there were any errors encountered during the last run. The compact summary is designed for quick review, so if everything is running normally, there’s no need to dive into the full report.
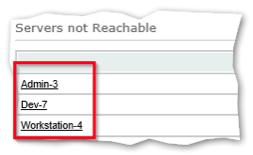
- The Servers not Reachable section is a short list of servers that are configured, but not reachable during checkup report generation and do not have any plan results within the last 24 hours. These may need immediate attention.
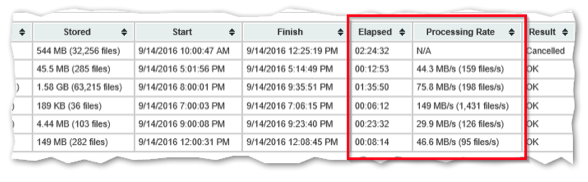
- Elapsed plan runtime is in the Protection Plan Summary section. Plans with unusually long or short runtimes can be more quickly identified.
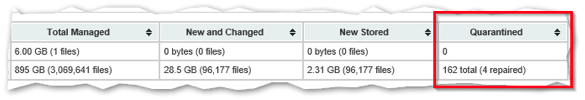
- The Store section includes statistics for Total Managed data, New and Changed content and New stored data as well as a column showing total quarantined items, content repaired, and new quarantined items. A sudden increase in quarantined items can be an early indication of issues with storage or network devices.
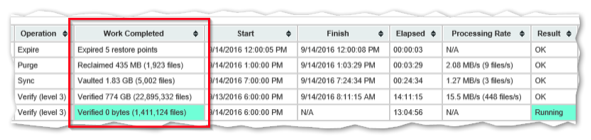
- The Store Task section includes a short description of the work done; content verified, disk space reclaimed from a Purge tasks, or bytes copied to another store; useful for confirming certain tasks are completing their expected workload.
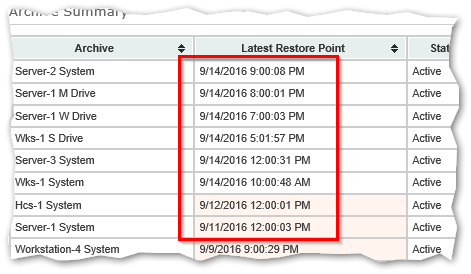
- The Archive Summary section shows the status of every archive and includes information about the last known restore point and current status: Available, Verified, Unavailable, etc. Archives older than a day (midnight on the previous day) are highlighted to better show those that may be unexpectedly out-of-date. Archives with no active plans are indicated as Read-Only.
Together these enhancements reduce the need to logon to the Archive Manager server and review individual plans and archives on a regular basis. The goal is to help you work more efficiently and have greater confidence that backups are working as expected and help you focus on important issues more quickly when your backup needs attention. We hope you find these features helpful. Tell us what you think and if you have other suggestions to make the Checkup Report even more helpful in your day to day effort of keeping your company or clients protected, email us at [email protected] with your suggestions.
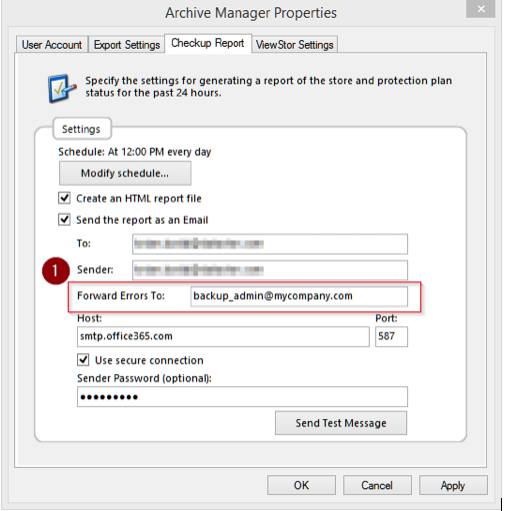
Configuring Alternate Recipients
From the Archive Manager node, select Properties and open the Checkup Report property page. There is now a new Forward Errors To field (@1) where you can add one or more recipients that will receive a copy of the Checkup Report only when new errors or warnings are detected. Use a comma to separate email addresses or leave the field blank if you don’t want to use this particular feature. The alternate recipient will receive the email when the scheduled checkup report runs and an error or warning is detected.
Working with Checkup Report Email Messages
The Checkup Report is embedded directly in the email sent to recipients and marked with “High Importance” when a problem needing attention is indicated. The tables shown in the message are static (not sortable), but you can view the Checkup Report in a browser to enable dynamic sorting of columns which is useful when exploring the report in more detail. The message below was displayed in a Checkup Report email received in an Outlook client.

Understanding the Report Summary
The Checkup Report has summary information in the header about the other sections of the report. It is intended to be compact and brief, and this information often will show in email preview, which is handy when checking the report from a smartphone, for example. This information includes the number of plans configured, and how many of those plans actually ran, and if any errors or warnings are indicated.
The header also includes current Storage status. If a Store has new quarantined items or is running low on free space, an error or warning will be indicated here as well as in the Storage Summary section of the report. Store tasks that run with errors or warnings will be shown along with any problems with the archives associated with each protection plan. Normally these results should show ‘OK’ indicating no issues were found and that everything is running normally. Errors and warnings should be investigated daily and addressed as soon as possible. The software includes numerous built-in and automated recovery operations and only when recovery steps are exhausted are errors or warnings posted.
Out-of-date archives might not strictly indicate an issue, for example, if a particular Protection Plan is no longer configured to run or a computer has been decommissioned or replaced, or a Plan is configured to run other than on a daily frequency; However, we provide a summary of the number of out-of-date active archives in the header, and highlight all all out-of-date archives in the Archive Summary section of the report. This is a quick indicator if any unexpected archives are missing current restore points.
Checking Server Status
The Servers not Reachable section identifies computers that appear to be down or non-responsive at the time the Checkup Report runs. When the Checkup Report runs it attempts to contact each configured computer to query the scheduled task on the remote computer for the last known runtime and will eventually timeout the request if the computer does not respond. If the Plan has generated a restore point within the last 24 hours, the Checkup Report removes the computer from the unreachable server list, having evidence that the computer was up and running at least within the last 24 hours. If a computer is decommissioned, or no longer being backed up, then delete the Protection Plan(s) from the user interface to avoid having it show up on this list.
In some cases, a schedule task can run normally on the remote computer, but the Checkup Report may fail to access the task information from the Archive Manager due to permissions or DNS issues. Use the Remote Computer troubleshooting guide in the embedded Help to address these kinds of issues.
Protection Plan and Storage Summary
For each plan executed in the last 24 hours, total runtime is shown in the Protection Plan Summary table under the Elapsed column. This is used for identifying plans that are running unusually long or even too quickly (e.g. doing less work than expected)
- Total Managed is the sum of all files and bytes processed from each of the last known restore points.
- New and Changed is the new and changed content tally for all archives in the store. This is the total dynamic data that is changing on a daily basis.
- New Stored is the actual bytes stored in the last 24 hours. Every restore point represents a full and complete recovery point, but through compression and deduplication only a small amount of data typically needs to be stored on a daily basis. This column shows how well deduplication is working in comparison to the Total Managed for a given Store.
- Quarantined keeps a running total of quarantined data and any of those items subsequently repaired. New quarantined items are flagged as errors if they weren’t immediately repaired. Generally, the occurrence of quarantined items are rare, and may indicate otherwise undetected disk or network errors. As disk capacities increases the probability of an occurrence of a disk corruption increases and there’s an increased likelihood that these would go undetected by the operating system. The Store verify task can be used to scan new and changed data as well as performing full data scan of all content to identify any and all disk corruptions. Consider running low-level file system checks like chkdsk or running the SAN or NAS disk utilities supplied by your device manufacturer, if you see a sudden increase in quarantined items. Your backup storage may need to be replaced if you see a continued increase in quarantined items.
Store Task Results
To help better understand the progress of various Store tasks listed in the Operation column, the Work Completed column includes a result summary. Review this section to confirm the various Store maintenance tasks are running against their expected workload.
Archive Summary Section
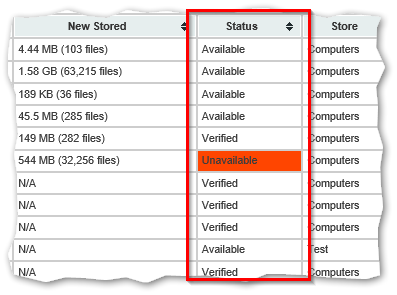
Last but not least, a the Archive Summary section provides a status summary of all archives in your store or stores in the last 24 hours. The goal is have secure, recoverable data, and this section tells you where things stand. The Latest Restore Point column shows the date and timestamp of the last known restore point for each archive. A soft highlight is used to visually indicate when a restore point for a given archive is older than a day (midnight on the previous day). This may or may not indicate a problem depending on how often the Protection Plan is scheduled to run, or for instance, if a corresponding Protection Plan has been disabled or deleted. The soft highlighting is an advisory and you’ll need to evaluate whether something needs to be done. The archive Status column will indicate any errors or warning if and when a recovery point is either incomplete, or unavailable.
Here’s a description of the possible Status field values:
- Available – the restore point is available for recovery
- Verified – the restore point has been independently verified by a Store Verify task and no issues were found. The status of a restore point might change in the future, for instance, if referenced data is subsequently quarantined and re-verified by a Store Verify task.
- Available, Incomplete – One or more missing items were detected for this restore point. To view all files impacted by this Status, Explore the archive from within the calendar view of Archive Manager and right-click and select Show Missing.
- Available, Partial – The Protection Plan ended early and only a partial backup was recorded for this restore point.
- Unavailable – A recovery point is indicated, but the corresponding catalog is missing or corrupt. This might be caused by a network interruption during the final phase of the backup. In this case, the catalog is saved on the remote computer, and the next plan run will attempt to copy the catalog back to the archive.
Reviewing this section gives you a quick snapshot of the status of all archives and what, if any, follow-up is needed.